Mapping
Mapping via app
If you are interested in looking at the corpus underlying the maps below, you can access my ShinyApp here.
With it, you can plot relative frequencies within the corpus and download the resulting maps.
Mapping via code
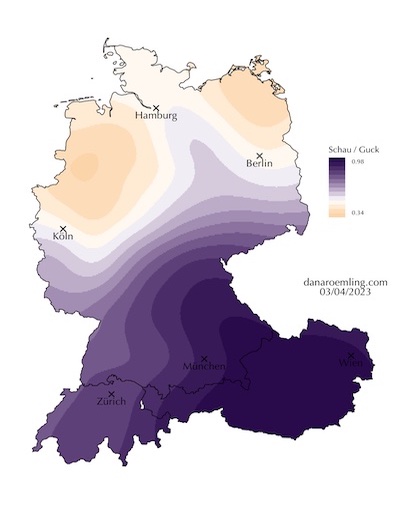
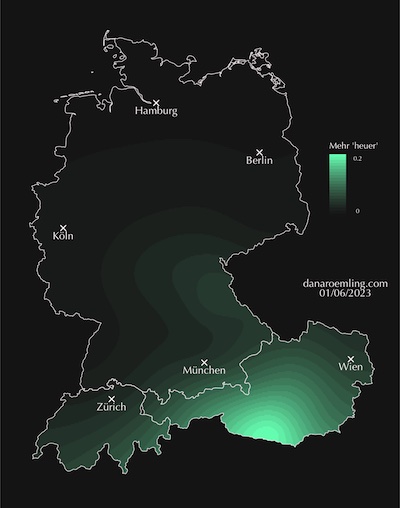
Part of my research is visualising linguistic data with maps. Mapping data is useful, for example, in regional dialectology or typology - or generally when your data is regionally distributed. Visualising linguistic variables can help identify patterns in the data and generally offers an easy way to present data.
Together with Bodo Winter and Jack Grieve I have published a tutorial on how to make maps in R. Please have a look here. We recommend using the pdf version to copy & paste code into R.
If you are interested in the code and similar resources, they can be found on my GitHub.
To give you an idea of what map visualisation might look like, here are two example maps based on the Jodel Corpus created by Dirk Hovy & Christoph Purschke (2018).